4-6%
a
n
n
u
a
l
f
u
e
l
r
e
d
u
c
t
i
o
n
C
l
e
a
n
i
n
g
S
c
h
e
d
u
l
e
O
p
t
i
m
i
s
a
t
i
o
n

H
u
l
l
M
o
n
i
t
o
r
i
n
g
&
F
o
u
l
i
n
g
M
a
n
a
g
e
m
e
n
t
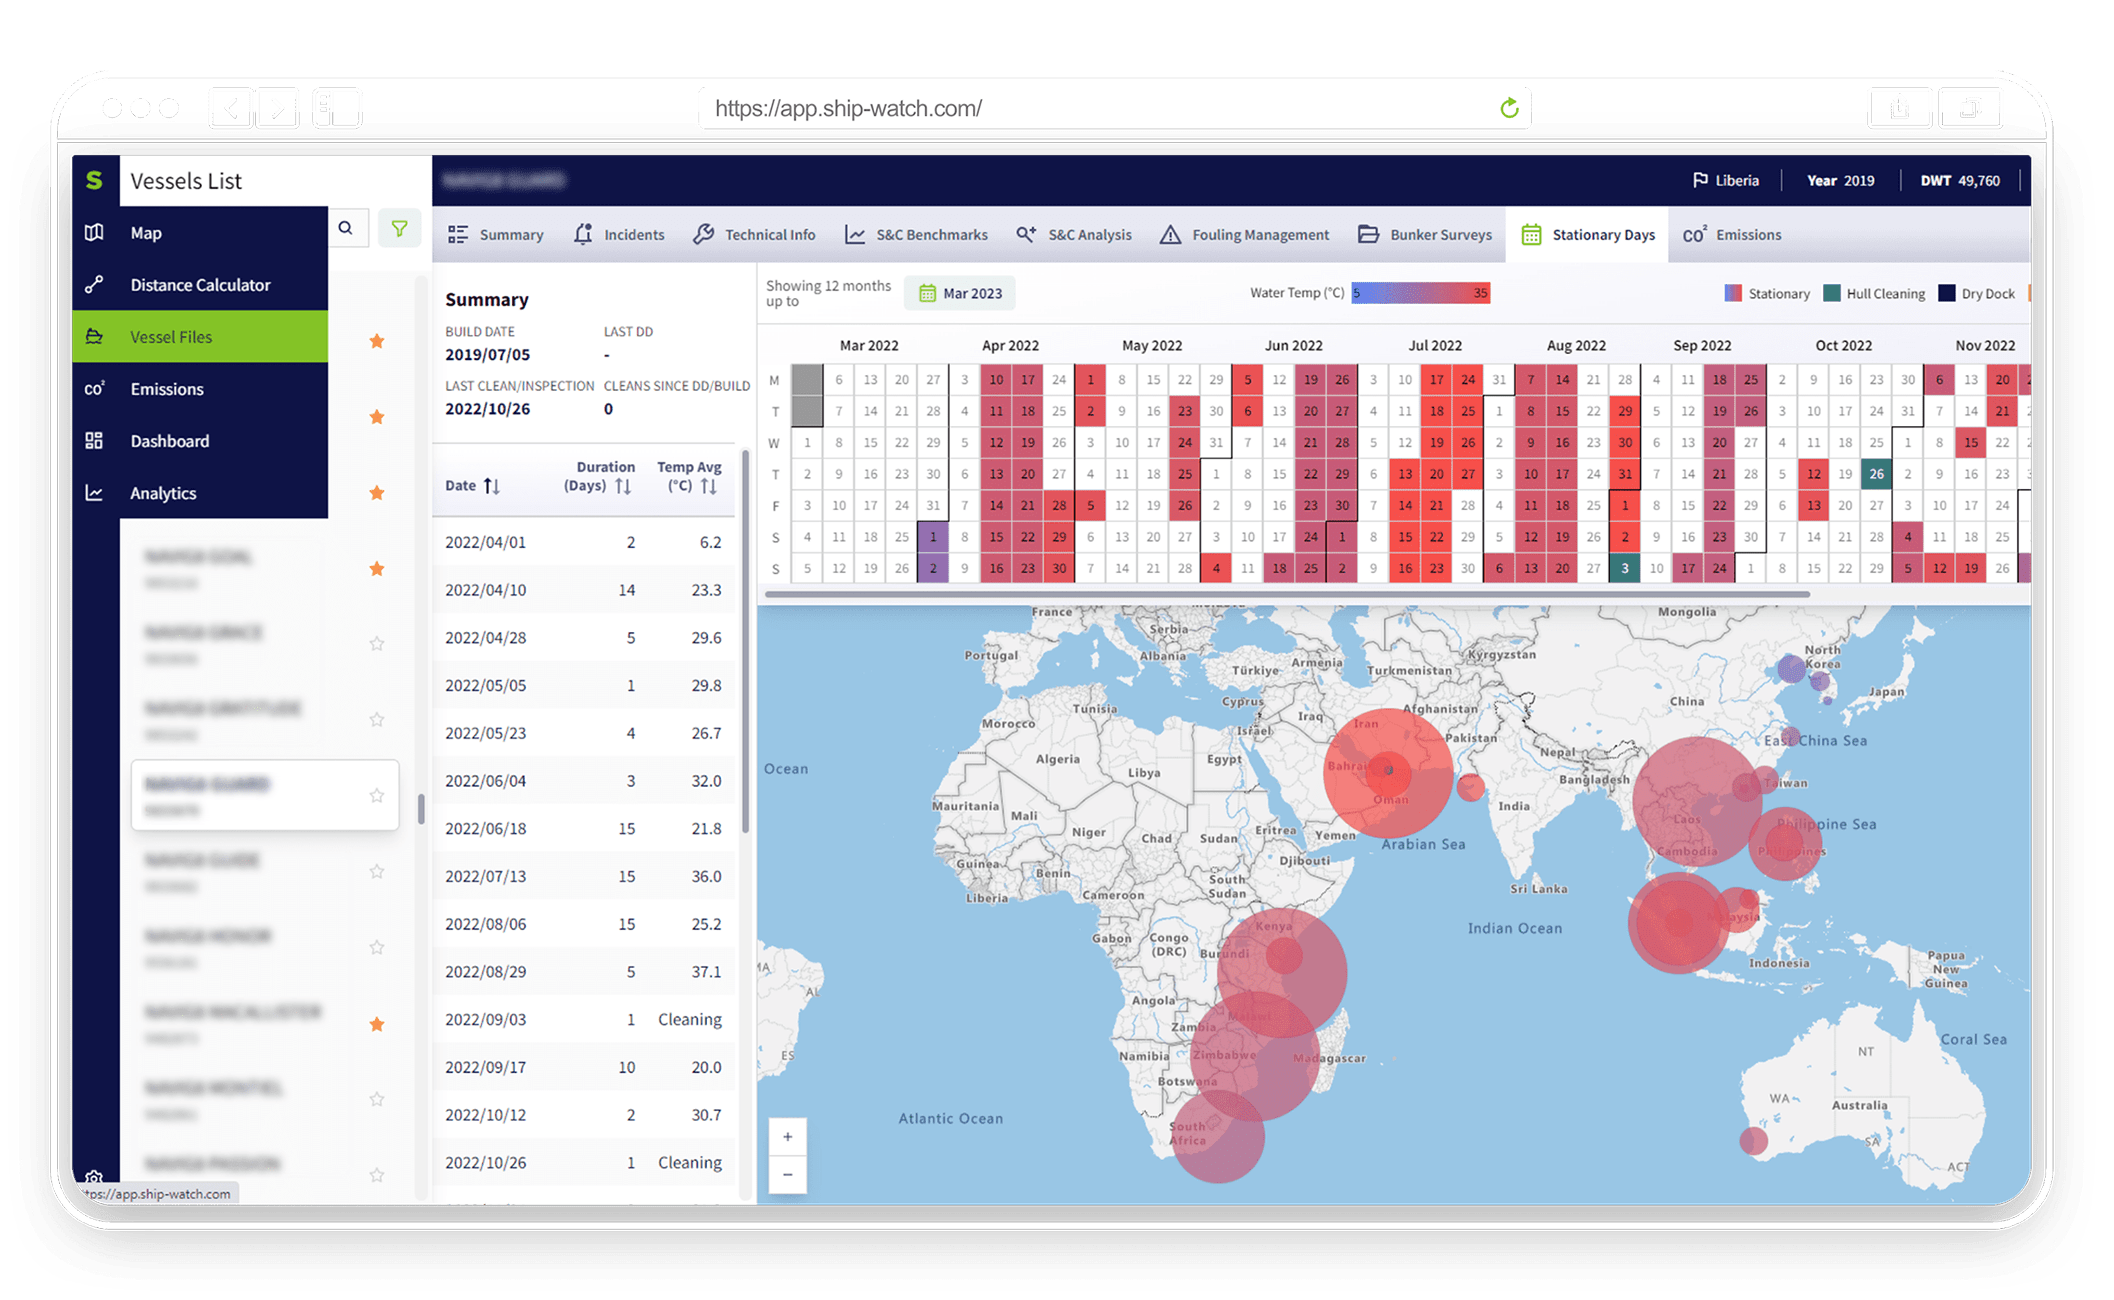
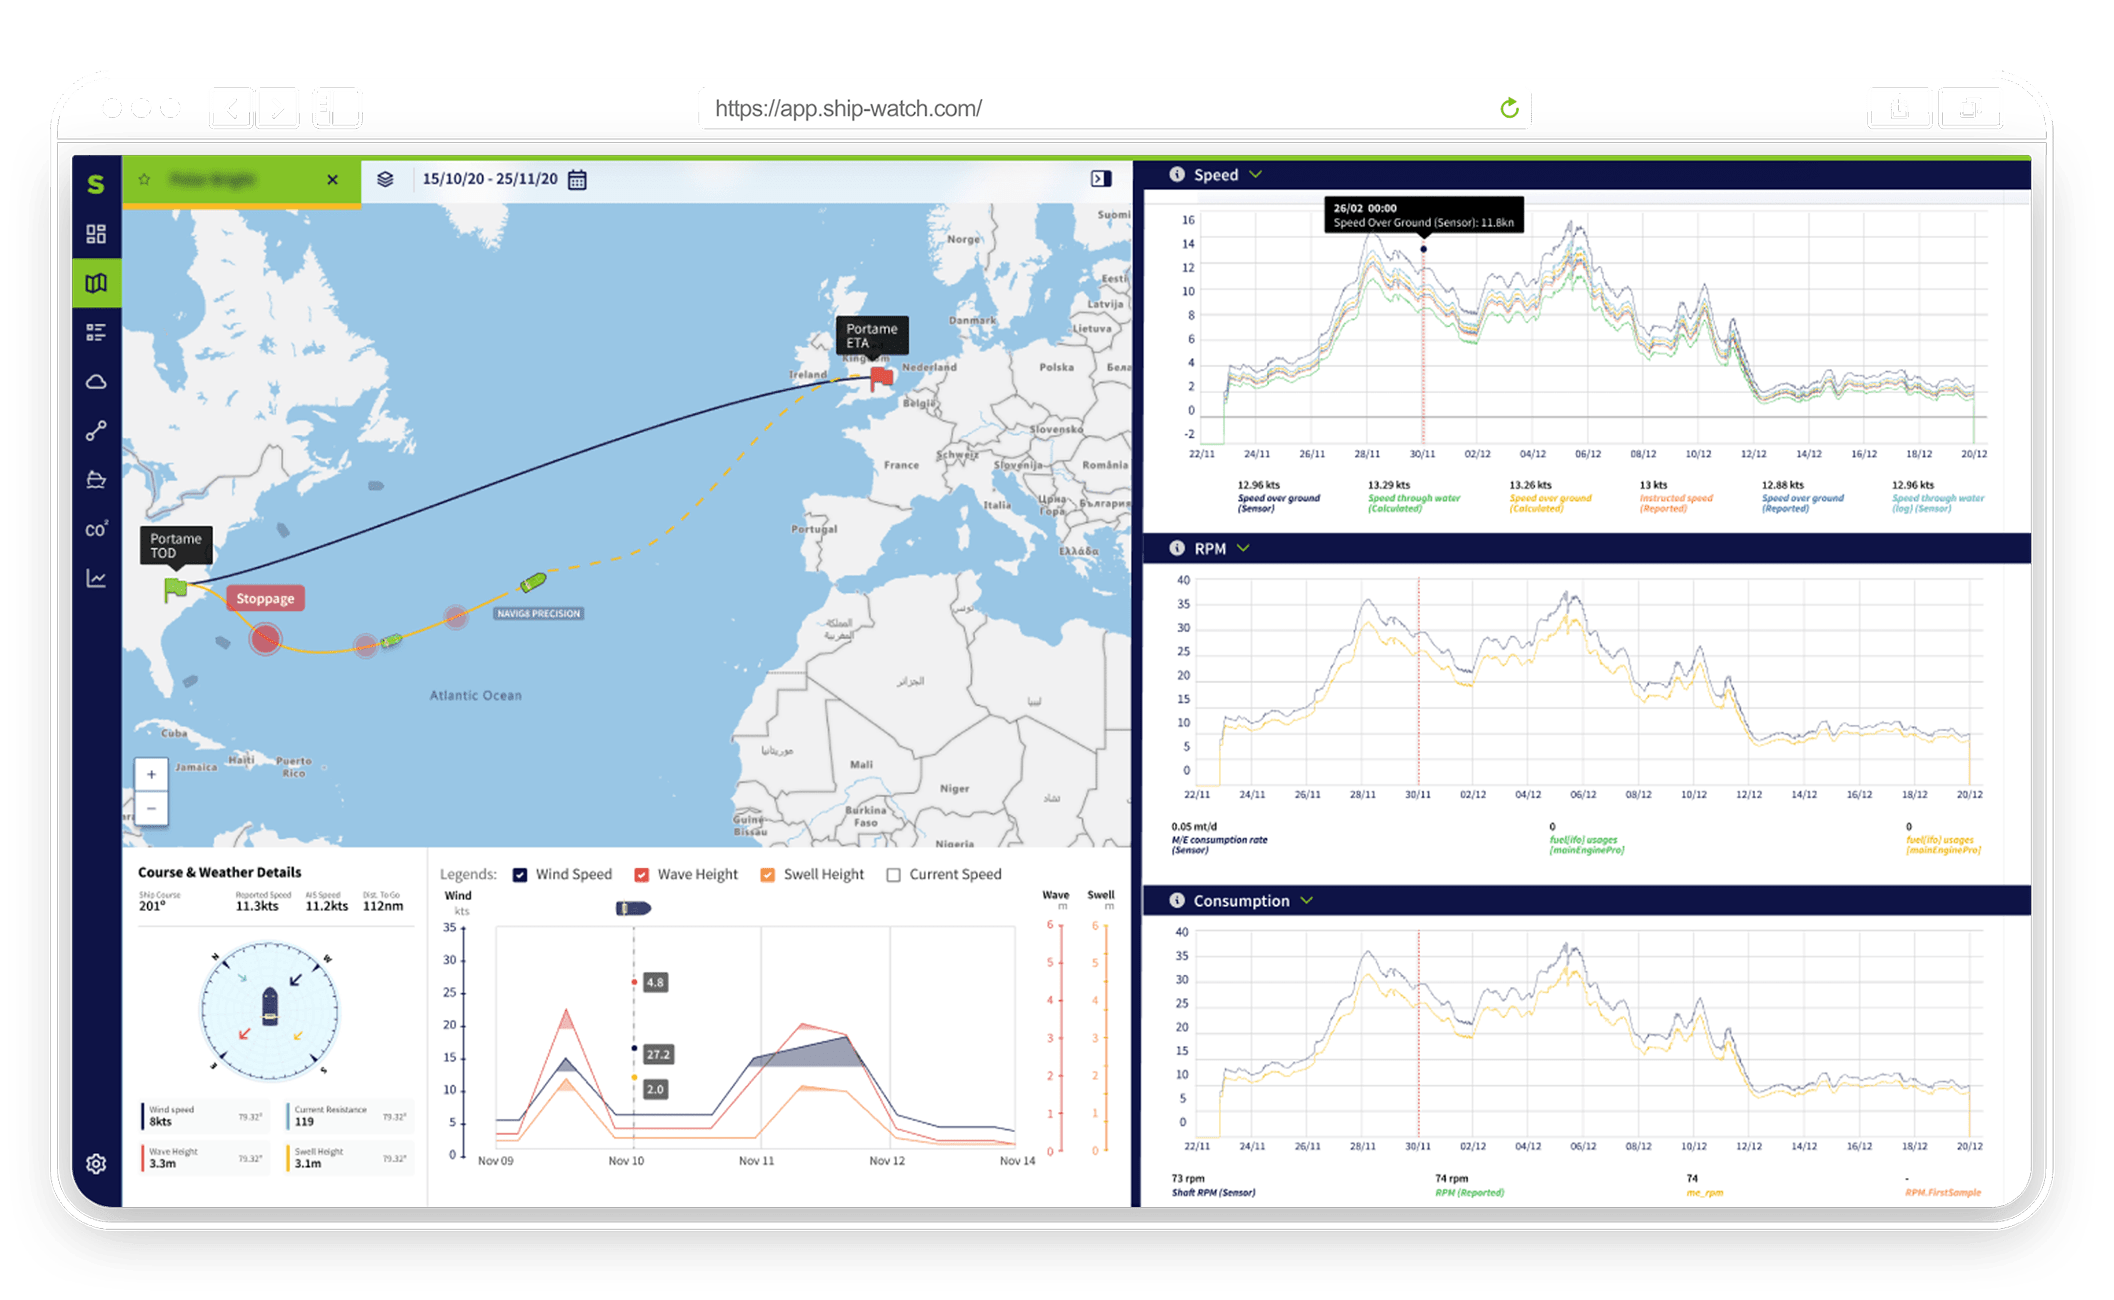
Our models use multiple KPIs to ensure we cover all aspects of fouling & pick up on it at the first opportunity. We monitor the efficiency of the hull, through our data tools.
Optimised
Cleaning Schedule
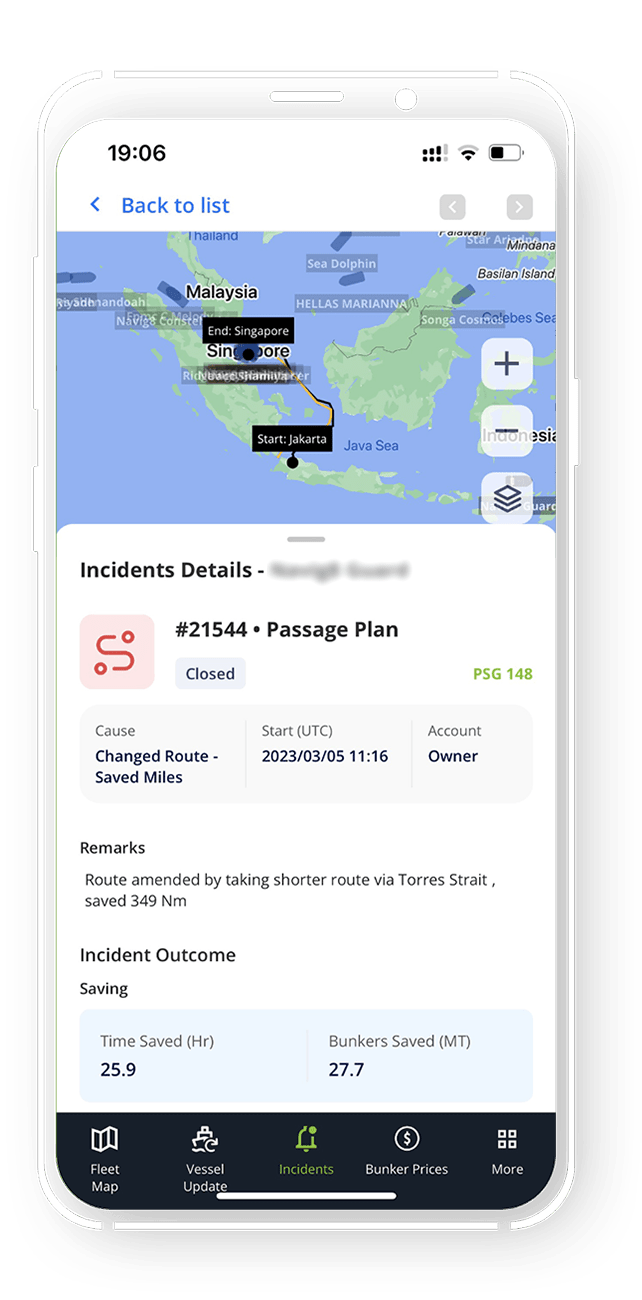
The optimal time to clean a vessel is a function of the vessel’s anti-fouling coating, dry dock cycle, trading pattern & fouling condition. We take a holistic approach to the cleanings to maximise the benefit of each clean
Post Cleaning
Analysis & Insight
After cleaning we perform an objective analysis of the effectiveness. As part of this report, we review the fouling severity and post clean performance improvement
The results of timely cleaning are evident